Pages

Tuesday, March 26, 2013

JPMorgan upgrades Malaysian Equities amid Election Risk 2013


KUALA LUMPUR: Malaysian equities have been upgraded to an “overweight” by JPMorgan in a report, which advised investors to buy quality growth stocks whose businesses relied on domestic demand andEconomic Transformation Programme (ETP)-related growth.
The bank's Kuala Lumpur- and Hong Kong-based analysts said investors should buy “quality growth stock” now as local equities have underperformed emerging markets while emerging markets have significantly underperformed developed markets.
They made their case based on the fact that Malaysian equities have underperformed Asean neighbours Indonesia, Thailand, and the Philippines whose growth were also based on domestic consumption and investment growth.
Among signs of growth and consumption, they said Malaysia's capital expenditure (capex) grew 20% in 2012 up from a five-year average of 7% while January vehicle sales grew 26%.
“Our economist forecasts 5.1% gross domestic product growth (GDP), similar to that for other Asean economies. The central bank is on hold. Inflation is modest the 2013 forecast is 2.3%,” they said, adding that private investment grew 22% last year with this year's to grow 15.6% while infrastructure is funded by a savings-investment gap at over 11% of GDP.
The ETP would be supported by a strong pipeline of RM211.3bil in committed investments derived from 152 entry point projects, with 149 projects announced. These projects were expected to generate gross national income of RM135.6bil in 2020 and create 400,000 jobs.
They said investors should “probably not wait” for the imminent dissolution of parliament, the last day of which to do so would be April 28. Following which, the general election must be held within 60 days.
“Investors are asking when to buy. Inbound investors' visits year to date are equivalent to the whole of 2012. Our advice is to buy quality growth stock now,” they said.
Furthermore, they said the Iskandar growth region continues to boom with cummulative investments hitting the RM100bil target in the third quarter of last year.
They pointed out that property demand remains strong in the growth region with several companies announcing multi-billion ringgit property projects.
The basket of stocks which they believe provides a strong franchise, domestic-led earnings growth and double-digit earnings per share growth were AMMB Holdings BhdAxiata Group BhdBerjaya Sports Toto BhdCIMB GroupDialog Group BhdGamuda BhdIJM Land Bhd,KLCC Property Holdings Bhd and Media Prima Bhd.
These stocks have potential for earnings and dividend upgrades. They said Axiata offers a healthy yield (4%) with higher dividend per share forecast, and double-digit earnings per share growth; CIMB is a high growth, low price-to-earnings ratio stock; Gamuda Bhd continues to leverage on the RM60bil MRT project and has a high backlog of RM10bil and KLCC Property is the largest, most liquid REIT with prime portfolio and offers 4.5% dividend yield, with potential upside.
Meanwhile, MIDF Research said the Malaysia and Indian stock markets escaped the global funds outflow deluge which hit Asian markets last week
As a weekly aggregate, the research house said net outflow of foreign equity investment for the seven markets it tracked increased to about US$2.7 trillion, the highest weekly outflow since mid-May 2012.
The seven markets in MIDF's research coverage are South Korea, Taiwan, Thailand, Malaysia, Indonesia, the Philippines and India. The report noted that Malaysia continued to register net inflow of foreign equity capital albeit in smaller quantum last week whereas Indonesia, Thailand and the Philippines recorded negative foreign flows albeit well within the usual weekly cyclical band.

Source: Star Online

Friday, March 22, 2013

Malaysians Start Financial Planning at Age of 34 - HSBC Bank


KUALA LUMPUR: A recent survey by HSBC Bank Malaysia Bhd found that, on average, Malaysians expect to live 17 years in retirement but that their savings would only last 12 years.

          The future of retirement: a new reality report is based on a survey of over 15,000 people in 15 countries. It highlighted that 43% of Malaysians felt that they were not adequately prepared for retirement, with 10% taking an even bigger risk of not being prepared at all.
          HSBC head of retail banking and wealth management Lim Eng Seong said people are still running the risk of living long beyond their retirement savings. In a statement yesterday, he said: “Many Malaysians have begun to place importance on retirement planning and savings.”
                                       
        “This is an improvement from the last survey in 2011 where 68% of respondents were worried that they would not be able to cope financially in retirement.” The study also found that Malaysians understood the importance of preparing for retirement from a relatively young age with the average age for when they started planning financially at 34.
        When asked how much money they felt was needed to live comfortably, both now and when they retired, about 81% of the respondents said a sensible proportion of “working age” income would be required for a comfortable retirement.
                          
        Meanwhile, 68% of the respondents cited financial hardship around retirement as their most common concern whereas 59% of them were concerned about poor health around retirement.
       The survey also reported that 59% opted for the longer-term goal of retirement with only 37% choosing to save for the short-term goal of a holiday.

Source: theedgemalaysia.com


How to Set Our Budget


What is a Budget?


A budget is simply a plan for spending your money (now, does that get you excited?). Yes, most of us love to spend but very few are able to control their spending. A budget is a way to balance the money you have with the money you spend. You create a plan by making choices. You decide what you will spend money on, how much money you will spend and how much money you will save.
Your plan is based on your income and expenses. Income is money coming into your pockets. Expenses are things that take money out of your pockets. Since every person’s income and expenses are different, your plan needs to fit your situation (or your pockets!). Your budget is based on your Goals, Needs and Wants.
Let's take a look at some examples:
GOALSNEEDSWANTS
Own a Car
Own a Home
Get Married
Set up own business
Provide good education to children
Retire comfortably
Contribute to charity
Food
Shelter
Clothing
Quality time with family
Car/ Motorcycle
Mobile phone
Computer
Fine dining
Resort-like bungalow
Expensive branded clothes
Expensive vacations
Luxury car
Latest full-featured phone
Most advanced computer
Etc., etc., etc……
As you can see from the above, sometimes it’s hard to differentiate between Needs and Wants. As time evolves, our basic needs may extend to more than just food, shelter and clothing. A salesperson may work more effectively with a car (unless our public transportation system is super-efficient!) In today’s IT age, mobile phones are practically indispensable (even school children thinks so!), so are computers. However, there are cars that costs RM30,000+ while some, RM300,000+; mobile phones of RM100+ and some RM1,000+ and computers that costs RM1,000+ while some can go as high as RM10,000+!
We only Need a few things but our Wants are endless! Is it hard to differentiate now???

Why Should I Have One?

Anyone who has income and expenses needs a budget. Having a plan helps you use your money to reach your goals. You can learn and practice the skills that are needed to make a budget. This money plan will help you to be in control of your money. You can avoid financial trouble and reach your goals easier.
How Do I Start a Budget?
To make a money plan, list your Income and your Fixed Expenses, which are expenses that do not change from month to month, like rent, home and car installments or insurance premiums. Other expenses are Variable, i.e. they change from month to month, like utility bills, clothing or entertainment.
Next, you’ll need to keep track of how you are now spending your money. You can do this by writing down what you buy and how much you spend. This will take some time and effort but it is worthwhile because it will help you see where your money goes. Don’t be too surprised by what you’d learn about yourselves and your money!
For the next 30 days, every time you spend, write down in your planner (use the Excel spreadsheet, if you are tech-savvy) how much you spent and where you spent it. When you pay a bill, pump petrol, go to a movie, give money at church/ contribute zakat or even buying your favourite nasi lemak from the makcik around the corner, record everything down.
At the end of the month, use a calculator to total each column at the bottom of the chart to see how much money you spent in each area. Then, total all the columns to see how much money you spend in an average month. Get your children involved as this will not only sharpen their math skills but also expose them to the concept of budgeting (but a word of caution: they’ll then know when’s the best time to ask for their new toy!)

How Do I Decide Where to Spend My Money?

By reviewing your completed chart/ spreadsheet, you can see where your money goes. It is often helpful to discuss your chart with a counselor or someone you know who manages their money well.
A big part of your money is used for basic necessities like food, housing and clothing. These are needs and you will always be spending money on them in order to live but you can choose how much to spend. Other spending might include buying new clothes, new dishes or new toys for your children. These are wants. While you might enjoy spending money in these ways, you can live without them.
The following questions may help you decide what to do:
  • Which spending can’t be cut?
  • What is the minimum I need to live?
  • Which spending is Needs and which is Wants?
  • What would happen if I delayed some of my spending?
  • Can I buy cheaper substitutes?
Now that you have studied your chart and discussed the questions above, you are ready to make your personal budget. Write down how much money you need for each kind of expense for one month. For example: RM300 for food, RM100 for transportation, RM50 for savings and so on.
Try to set some short-term goals and long-term goals. Some short-term goals might be: limit money for food to RM10 per day, take the bus/ LRT instead or driving to work and check (your neighbour’s) newspaper for free family entertainment. Some long-term goals might be: save RM1,000 for a new refrigerator (energy-saving & environmentally-friendly models would be ideal!), get out of debt or perhaps move to a different neighbourhood (or as some might say, balik kampung!)

How Do I Stick to My Budget?

This is the hardest part, mind you! It will take practice and self-discipline to follow your budget. You are the only one who can maintain your plan. Here are some suggestions that can help you stick to your budget:
  • Pay necessary bills first. If possible, try to stretch your bills out evenly over the month so they are not all due on the same day.
  • Save some money every month, no matter how small. You just want to form that habit.
  • Make a list before you go shopping. When you shop, remember the difference between needs and wants.
  • Plan ahead and buy items on sale. Check out discount stores and garage sales. Share reusable items with family and friends.
  • Stay away from stores or places where you waste money!
  • Learn ways from family and friends to save money and follow a plan.
  • Keep a record of where you spend money and how much money is spent. Make it simple and easy to do. (Tip: the “555 pocket-book” may come in handy!)
  • Compare this record to your written money plan so you can see if you are following your spending decisions.

When Should I Change My Budget?

Don’t panic or feel disappointed if you are unable to follow your budget completely. It takes time and practice to change any behaviour, especially spending habits! You may need to change your budget as your needs or the needs of your family change. If your income increases or decreases, you will also have to make adjustments. The important thing is that you have a plan and that you are in control of your money.
Last but not least, remember to always “Make Prudent Financial Management a Way of Life!

For more information, can kindly visit http://www.akpk.org.my

Tuesday, March 19, 2013

Stressful Jobs That Pay Badly


For many workers, stress is part of the job description. And sometimes, the compensation doesn't match the pressures. Here are some of the most high-stress, low-paying jobs.

Barista
ThinkstockMedian pay: $20,300
% who say their job is stressful: 50.3%


Who would have thought that life at a coffee shop could be so stressful? Baristas, though, quickly learn that dealing with customers before they've had their morning (or afternoon or evening) cup of coffee isn't always as pleasant as a vanilla spice frappuccino.

Lines can swell as indecisive customers mull choices. Some come in with massive orders. Others complain about coffee being too cold, too hot, too sweet, not sweet enough... The sheer volume of sales insures that some customers will be unhappy -- and will let the barista know about it.

And the tension can build since company policy at most coffee bars is that the customer is always right -- even when they're wrong.

Special education teacher's aide
Median pay: $22,700
% who say their job is stressful: 59.3%


These teacher's aides get great hands-on experience working with students with physical, learning or behavioral challenges. But the stress levels can run high.

Since many aides come to the classroom with little experience, they end up learning on the job, said George Giuliani, executive director of the National Association of Special Education Teachers. And sometimes their working relationship with the teacher -- who is effectively their boss -- can be strained.

"[Aides] work under direct supervision of teachers and they may have a different sense of what their roles are," said Giuliani.

Most find it very rewarding, however, he said, although the monetary rewards tend to be very low. Median pay is less than $25,000 a year.

Loss prevention officer
ThinkstockMedian pay: $23,000
% who say their job is stressful: 54.3%


Loss prevention officers typically monitor retail floors for shoplifters, watching video screens or walking the aisles.

"The most stressful part of the job is to decide when to apprehend and when not to," said Gene Smith, a veteran of 35 years in the industry and president of the Loss Prevention Foundation. "You have to be right 100% of the time."

A wrong call could bring a lawsuit, but being too hesitant could mean lost inventory.

Safety is another concern. They never know when a shoplifter will pull out a knife or gun.

Yet, wages fall well short of the judgment and guts required of the job. The median pay is only $23,000.

Day care teacher
Median pay: $24,200
% who say their job is stressful: 60.5%


Working with two-to-six-year olds in public schools or daycare centers, these teachers can put in up to 12-hour days.

"Young children are demanding physically, mentally and emotionally," said Debora Wisneski, President of the Association for Childhood Education International.

But the most stressful part is "the precariousness of the job market."

While the long-term outlook for the profession is strong, according to the Bureau of Labor Statistics, the current high unemployment rate means more moms and dads are staying home and taking care of the kids themselves.

Veterinarian's assistant
ThinkstockMedian pay: $25,500
% who say their job is stressful: 72.6%


Lori Asprea is a veterinary assistant at New York's Animal Medical Center, the largest facility of its kind in the world.

The animal hospital often gets the hardest cases, the ones regular vets can't handle.

"We see a lot of very ill animals and many are here a long time," said Asprea. "Emotionally, you get very attached."

And with a national median salary of under $26,000, the financial toll can be just as steep.

But helping animals makes up a lot of the difference. "I love all my patients," said Asprea.

Job coach
Median pay: $31,400
% who say their job is stressful: 84.8%


Job coaches help people with physical, emotional or mental disabilities get and keep jobs.

They have to juggle field work with a ton of paperwork, said Thea Noel, who works for Goodwill Industries in Atlanta. A pressure-packed part of the job is negotiating with employers on behalf of her clients.

The pay is often low, especially for job coaches dealing with emotionally unstable clients, said Kim Mueser, executive director at the Center for Psychiatric Rehabilitation in Boston.

"The way our mental health system works, job coaches are paid at low rates compared with others in the rehab field," he said.

Concierge
ThinkstockMedian pay: $34,200
% who say their job is stressful: 81.9%

Concierges do for hotel guests, apartment dwellers and independent clients what they don't have time to do for themselves.

"The stress is pleasing the client and doing that in a way that makes you happy as well," said Katherine Giovanni, founder of Triangle Concierge.

The public is not always "warm and fuzzy," however, said Giovanni. Many clients are demanding. One concierge had a client so harsh she had to retreat to the bathroom every day for a good cry.

Giovanni advised her to leave the client. The economics of the job can make that tough sometimes, however. Concierges had a median income of less than $35,000 in 2012, according to PayScale, so every paying customer counts.

Source: Yahoo.com

Friday, March 15, 2013

Intellectual capital is source of wealth in the future


INTELLECTUAL capital will overtake commodity capital as a source of wealth in the future, and those who fail to recognise this will fall by the wayside of history, futurist Michio Kaku said yesterday at the Credit Suisse Global Megatrends Conference.
"Food prices have been dropping for 150 years. Better competition, mass production, better containerisation, shipping, while intellectual capital has risen in price. Why is that? You cannot mass produce the brain."
Countries and companies that take a progressive view of embracing innovation and technology will come out better, Prof Kaku said.
China, for example, has a programme where they send the brightest students in the country to the United States for further studies, because "they can't sit and repair shoes forever". "In the big picture, countries which understand the relationship between commodity capital and intellectual capital will thrive in the future."
The theoretical physicist said that the key technology of the future will be a combination of four broad areas: telecommunications and computers; biotechnology; artificial intelligence; and nano and quantum technology.
He also described a trend of digitising, in which products and services will eventually be translated into zeroes and ones to be accessed via the information technology (IT) cloud.

Education and medicine, in particular, are industries that are ripe for such a move.
He described technology that can enable "robo-docs" to provide remote, artificial intelligence-driven medical care, and diagnostic technology such as "smart toilets" for early detection of cancer.
Such technology can not only improve health care, but also reduce the cost of health care, Prof Kaku said.
Taking a step back, he viewed the inevitable ubiquity of IT as ultimately leading to "perfect capitalism".
In this scenario, customers have perfect knowledge of the market. Because of instant access to technology and information, customers can easily find the cheapest source of a particular product, for example, or reviews by other users. In essence, markets will be more efficient, but the advantage will shift to the customer.
Businesses will have to respond by making sure that they have the best product, because customers will know who has the best product, Prof Kaku said.
To achieve that goal, businesses will have to invest in data mining, for instance, to know exactly what their customers want.
Intangibles such as branding and service quality will also take on additional importance.
"Friendliness, that human touch, will be the decisive factor in building reputation for your products," he said.
Source: Business Time

Thursday, March 14, 2013

6.80 sen ASM dividend for Year Ending March 2013

HIGHEST IN FIVE YEARS:  Total income distribution includes 0.30 sen per unit bonus, amounting to RM913.85 million Amanah Saham Nasional Bhd (ASNB) yesterday announced a total income distribution of 6.80 sen per unit for Amanah Saham Malaysia (ASM) for the financial year ending March 31 2013, the highest in five years. 

The total income distribution comprises an income distribution of 6.50 sen per unit and a "bonus" 0.30 sen per unit, said Permodalan Nasional Bhd (PNB), which owns ASNB.

The total income distribution of 6.80 sen per unit is higher compared with 6.50 sen per unit paid out last year, 6.38 per cent (2011), 6.3 per cent (2010) and 6.25 per cent (2009).

The payout will amount to RM913.85 million, an increase of 11.6 per cent compared with RM818.62 million last year.
The payment will benefit 542,809 unitholders who currently hold 13.44 billion units of ASM.

Up till Monday, ASM has recorded a gross income of RM1.07 billion with profit from the sale of shares contributing RM505.19 million, or 47.3 per cent.

Dividend income from investments in companies contributed RM376.75 million, or 35.3 per cent, and the remaining income of RM185.09 million, or 17.4 per cent, is derived from investments in short-term instruments.

ASM is an "equity-income fund" aimed at providing unit holders with a long-term investment opportunity to generate regular and competitive returns through diversified portfolio of investments.

Commenting on ASM's performance vis-a-vis the stock market performance, PNB chairman Tun Ahmad Sarji Abdul Hamid said the equity income fund did well despite the external uncertainties that also weighed on the stock market performance.

Meanwhile, PNB president and chief executive officer Tan Sri Hamad Kama Piah Che Othman said the country's biggest fund manager is still keen to pursue opportunities in London after its earlier four investments.

Its first investment in London was in December 2011 when it bought a 12-storey office space in Milton & Shire House on 1 Silk Street for STG350 million (RM1.72 billion).

It also has investment interest in Australia where it has purchased Santos Place in Brisbane, Australia, for A$290 million (RM916.4 million).

On Menara Wawasan, Hamad Kama said the company is trying to fulfil all of the requirements and conditions for the proposed building, which will be located within the Stadium Merdeka and Stadium Negara heritage area.

It has obtained the development order from Kuala Lumpur City Hall to build the 100-storey building, which will be higher than the Petronas Twin Towers.

Several months ago, Hamad Kama said 80 storeys of Menara Wawasan will be allocated for offices, 75 per cent of which has been set aside for companies under PNB.

Source: Business Times

Saturday, March 9, 2013

Difference Between Rich & Poor by Grant Cardone

Friday, March 8, 2013

2013 Top 10 Best Performing Unit Trust Funds


Below are Top 10 Best Performing Unit Trust Fund as of 15th January 2013. Funds are grouped according to 4 Major Categories consisting of:

1. Equity Malaysia
2. Asia Excluding Japan
3. Greater China
4. Fixed Income (Malaysia)

All funds are ranked according to their Average 5 Year Returns (Annualized). 

Starting today, I'll be introducing a simple system to track the movement of the Top 10 funds in comparison to their previous ranking. Therefore the Top 10 funds for 15th January 2012 are compared with the fund previous ranking (1st January 2012). Funds movement are indicated based on the legend shown below:
Category : Equity Malaysia (Click Picture to Enlarge)


Overview for Equity Malaysia:
1. The usual suspects of MAAKL-HDBS Fixed Fund, AMB Dividend Trust Fund and Kenanga Growth Fund occupy the top three position of the best performing Equity Malaysia Fund once again. The big three as I would like to term them have also average more then 11% returns annualized over the 5 year period making them the choice of investment for many unit trust investors.
2. Impressive 1 year returns from Philip Master Equity Growth Fund and MAAKL Al-Fauzan helped raised respective Average 5 Year Returns.

Funds to watch :
1. MAAKL Al-Fauzan
2. Public Focus Select Fund
3. Hwang AIIMAN Growth (there is a similar fund offered by Hwang Management Sdn. Bhd. for PRS investment, clickHERE to read more)

Category : Asia excluding Japan (Click Picture to Enlarge)


Overview for Asia excluding Japan
1. The top 5 of Asia excluding Japan funds have posted double digit returns for the past one year. A good sign that the Asia market is recovering. I've read several articles which are also expecting better performance of the Asia economy for 2013. Recommended to buy only as a diversification of your portfolio.
2. We also see the entry of MAAKL Pacific Fund into the top 10 list in place of PB Islamic Asia Strategic Sector Fund.. The rise of MAAKL Pacific Fund is due to the 13.06% returns for the one year period (3rd best ranked fund over the one year period).

Funds to watch:
1. MAAKL Pacific Fund
2. Hong Leong Asia-Pacific Dividend Fund
3. PB Islamic Asia Equity Fund

Category : Greater China (Click Picture to Enlarge)


Overview for Greater China
1. The top 10 funds remain unchanged in terms of ranking. As I have mentioned previously, buying Greater China funds is an option if your intend to diversify your portfolio. 
2. One year performance of all the funds are encouraging especially funds from CIMB.

Funds to watch:
1. CIMB-Principal Greater China Equity Fund
2. PB China Pacific Equity Fund
3. Hwang China Select Fund

Category : Fixed Income - Malaysia (Click Picture to Enlarge)


Overview Fixed Income - Malaysia
1. AmDynamic Bond remains the best performing Fixed Income - Malaysia fund. Not surprising with the average of 8.59% returns over 5 years. 
2. KAF Bond Fund rises from 4th to 3rd rank although their 1 year performance have not been encouraging. I believe the past couple of years, KAF Bond Fund should be averaging quite a high figure only to see a drop in ranking recently due to poor performance. Good news for all as KAF Bond Fund can now be purchased at Fundsupermart!

Source: i3investor.com

Wednesday, March 6, 2013

Top 10 World's Youngest Billionaires 2013


There are 1,426 billionaires in the world this year. They are the wealthiest of the wealthy. But only 23 members of this elite list are under 40 years old, with that exciting combination of money and youth.
Those 23 have a total of $68 billion between them. Eight come from the technology sector, including four from social networking giant Facebook. Nine come from the United States, the rest from countries abroad. Three are newcomers to the billionaire ranks. Read the full list below (ordered from youngest to oldest).

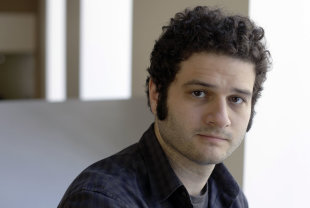
No. 1: Dustin Moskovitz

(AP Photo/Eric Risberg)Age: 28
Net Worth: $3.8 billion

Moskovitz, Mark Zuckerberg's former roommate, no longer works at Facebook, the social networking giant that he co-founded. A signee of Bill Gates' andWarren Buffett's Giving Pledge, Moskovitz bikes to work, flies commercial, and pitches his own tent at Burning Man.
[More from Forbes: The World’s Richest Women]

No. 2: Mark Zuckerberg
Age: 28
Net Worth: $13.3 billion

Few CEOs of any age are under more media scrutiny than Zuckerberg (who's only 8 days older than Moskovitz). Since taking Facebook public in May 2012, and getting married days later, the hoodie-wearing founder has seen his net worth rise and fall with every fluctuation of the stock price.

No. 3: Albert von Thurn und Taxis
Photo: GettyAge: 29
Net Worth: $1.5 billion

Albert von Thurn und Taxis first appeared in Forbes' billionaire rankings at age 8 but officially inherited his fortune in 2001 on his 18th birthday. The eligible bachelor is also a race car driver and tours with a German auto-racing league.

[More from Forbes: Newcomers To This Year’s Billionaires List]


No. 4: Scott Duncan


Age: 30
Net Worth: $5.1 billion

Duncan is the youngest of the four children who inherited the massive fortune of late energy pipeline entrepreneur Dan Duncan, founder of Enterprise Products Partners. Today the company owns more than 50,000 miles of natural gas, oil, and petrochemical pipelines.

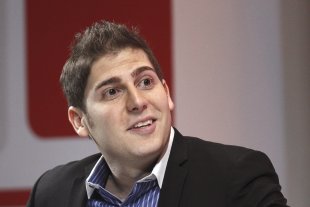
No. 5: Eduardo Saverin
REUTERS/Edgar SuAge: 30
Net Worth: $2.2 billion

Facebook co-founder Saverin renounced his United States citizenship in 2011, news of which broke days before the company's IPO and drew accusations of tax evasion. Saverin, immortalized in The Social Network as Mark Zuckerberg's onetime best friend, settled a lengthy legal battle with Facebook, apparently receiving a 5% stake. A Brazilian citizen, he now resides in Singapore and invests in startups.


No. 6: Huiyan Yang

Age: 31
Net Worth: $5.7 billion

Yang, the daughter of the founder of real estate developer Country Garden Holdings, is once again China's richest woman. Her father transferred his stake to the Ohio State grad before the company's IPO in 2007.

No. 7: Fahd Hariri

Hariri brothers, from left: Ayman, Saad and Fahd (Photo: AP)Age: 32
Net Worth: $1.35 billion

Hariri is the youngest son of slain Lebanese Prime Minister Rafik Hariri. He graduated from the Ecole Spéciale d'Architecture de Paris in 2004. While still a student, he ran an interior design studio on the outskirts of the city, and sold furniture to clients in Saudi Arabia.


No. 8: Marie Besnier Beauvalot
Age: 32
Net Worth: $1.5 billion

Marie, along with siblings Emmanuel, 42, and Jean-Michel, 45, inherited French dairy giant Lactalis, producers of popular Président brie among hundreds of other cheese, milk and yogurt brands.

No. 9: Sean Parker

(REUTERS)Age: 33
Net Worth: $2 billion

Parker is revamping his much hyped start-up, Airtime, with the hopes that the video chat site will have the impact of his other Web companies. At 19, Parker skipped college to disrupt the recording industry with music swapping site Napster. He served as Facebook's first president at age 24.


No. 10: Ayman Hariri


Age: 34
Net Worth: $1.35 billion

Hariri is the son of slain Lebanese Prime Minister Rafik Hariri. He's involved in running Saudi Oger, one of Saudi Arabia's biggest construction companies, and the source of the Hariri family fortune.

Source: Yahoo.com

TOP 200 World University Rankings 2012-2013

The Times Higher Education World University Rankings 2012-2013 powered by Thomson Reuters are the only global university performance tables to judge world class universities across all of their core missions - teaching, research, knowledge transfer and international outlook. The top universities rankings employ 13 carefully calibrated performance indicators to provide the most comprehensive and balanced comparisons available, which are trusted by students, academics, university leaders, industry and governments.


World University Rankings 2012-2013

RankInstitutionCountry / RegionOverall scorechange criteria
1California Institute of TechnologyUnited States
95.5
2Stanford UniversityUnited States
93.7
2University of OxfordUnited Kingdom
93.7
4Harvard UniversityUnited States
93.6
5Massachusetts Institute of TechnologyUnited States
93.1
6Princeton UniversityUnited States
92.7
7University of CambridgeUnited Kingdom
92.6
8Imperial College LondonUnited Kingdom
90.6
9University of California, BerkeleyUnited States
90.5
10University of ChicagoUnited States
90.4
11Yale UniversityUnited States
89.2
12ETH Zürich – Swiss Federal Institute of Technology ZürichSwitzerland
87.8
13University of California, Los AngelesUnited States
87.7
14Columbia UniversityUnited States
87.0
15University of PennsylvaniaUnited States
86.6
16Johns Hopkins UniversityUnited States
85.6
17University College LondonUnited Kingdom
85.5
18Cornell UniversityUnited States
83.3
19Northwestern UniversityUnited States
83.1
20University of MichiganUnited States
82.6
21University of TorontoCanada
82.2
22Carnegie Mellon UniversityUnited States
81.5
23Duke UniversityUnited States
81.2
24University of WashingtonUnited States
79.9
25University of Texas at AustinUnited States
78.8
25Georgia Institute of TechnologyUnited States
78.8
27University of TokyoJapan
78.3
28University of MelbourneAustralia
77.9
29National University of SingaporeSingapore
77.5
30University of British ColumbiaCanada
77.3
31University of Wisconsin-MadisonUnited States
76.9
32University of EdinburghUnited Kingdom
76.1
33University of Illinois at Urbana ChampaignUnited States
75.8
34McGill UniversityCanada
75.7
35The University of Hong KongHong Kong
75.6
35University of California, Santa BarbaraUnited States
75.6
37Australian National UniversityAustralia
75.4
38University of California, San DiegoUnited States
75.2
39London School of Economics and Political ScienceUnited Kingdom
73.1
40École Polytechnique Fédérale de LausanneSwitzerland
73.0
41New York UniversityUnited States
72.8
42University of North Carolina at Chapel HillUnited States
72.4
42Karolinska InstituteSweden
72.4
44University of California, DavisUnited States
71.8
44Washington University in St LouisUnited States
71.8
46Peking UniversityChina
70.7
47University of MinnesotaUnited States
70.5
48Ludwig-Maximilians-Universität MünchenGermany
70.4
49University of ManchesterUnited Kingdom
70.1
50Pohang University of Science and TechnologyRepublic of Korea
69.4
51Brown UniversityUnited States
68.9
52Tsinghua UniversityChina
67.1
53Ohio State UniversityUnited States
67.0
54Boston UniversityUnited States
66.8
54Kyoto UniversityJapan
66.8
56University of Southern CaliforniaUnited States
66.3
57King's College LondonUnited Kingdom
66.2
58KU LeuvenBelgium
66.1
59École Normale SupérieureFrance
65.9
59Seoul National UniversityRepublic of Korea
65.9
61Pennsylvania State UniversityUnited States
65.8
62École PolytechniqueFrance
65.7
62University of SydneyAustralia
65.7
64Leiden UniversityNetherlands
65.1
65University of Queensland AustraliaAustralia
64.4
65Hong Kong University of Science and TechnologyHong Kong
64.4
67Utrecht UniversityNetherlands
64.1
68Korea Advanced Institute of Science and TechnologyRepublic of Korea
64.0
69Purdue UniversityUnited States
63.8
70Wageningen University and Research CenterNetherlands
63.2
70Georg-August-Universität GöttingenGermany
63.2
72University of MassachusettsUnited States
62.9
72Erasmus University RotterdamNetherlands
62.9
74University of BristolUnited Kingdom
62.5
75Rice UniversityUnited States
62.0
76University of PittsburghUnited States
61.7
77Delft University of TechnologyNetherlands
61.6
78Universität HeidelbergGermany
61.4
79Emory UniversityUnited States
61.3
80Durham UniversityUnited Kingdom
60.7
81Université Pierre et Marie CurieFrance
60.5
82Lund UniversitySweden
60.3
83University of AmsterdamNetherlands
60.1
84University of MontrealCanada
59.8
85University of New South WalesAustralia
59.6
86Nanyang Technological UniversitySingapore
59.4
87Tufts UniversityUnited States
59.1
88McMaster UniversityCanada
59.0
89University of ZürichSwitzerland
58.8
89University of GroningenNetherlands
58.8
91University of Colorado BoulderUnited States
58.7
92Université Paris-SudFrance
58.6
93Ghent UniversityBelgium
58.4
94University of Notre DameUnited States
58.3
94Michigan State UniversityUnited States
58.3
96University of California, IrvineUnited States
58.2
97University of Maryland, College ParkUnited States
57.9
98University of ArizonaUnited States
57.7
99Rutgers, The State University of New JerseyUnited States
57.5
99Humboldt-Universität zu BerlinGermany
57.5
99Monash UniversityAustralia
57.5
102University of RochesterUnited States
57.2
103University of YorkUnited Kingdom
57.1
104Case Western Reserve UniversityUnited States
56.9
105Technische Universität MünchenGermany
56.8
106Vanderbilt UniversityUnited States
56.6
106Uppsala UniversitySweden
56.6
108University of St AndrewsUnited Kingdom
56.5
109University of HelsinkiFinland
56.4
110University of SussexUnited Kingdom
56.2
110University of SheffieldUnited Kingdom
56.2
110Trinity College DublinRepublic of Ireland
56.2
113University of Cape TownSouth Africa
55.8
114Eindhoven University of TechnologyNetherlands
55.6
115Maastricht UniversityNetherlands
55.5
116Aarhus UniversityDenmark
55.3
117Stockholm UniversitySweden
55.2
118University of VirginiaUnited States
55.0
119Royal Holloway, University of LondonUnited Kingdom
54.9
120University of NottinghamUnited Kingdom
54.8
121University of AlbertaCanada
54.7
122University of California, Santa CruzUnited States
54.5
122University of FloridaUnited States
54.5
124University of WarwickUnited Kingdom
54.4
124Dartmouth CollegeUnited States
54.4
124Chinese University of Hong KongHong Kong
54.4
127Radboud University NijmegenNetherlands
54.0
128Freie Universität BerlinGermany
53.7
128Tokyo Institute of TechnologyJapan
53.7
130University of SouthamptonUnited Kingdom
53.6
130Université de LausanneSwitzerland
53.6
130University of CopenhagenDenmark
53.6
133University of GenevaSwitzerland
53.5
134National Taiwan UniversityTaiwan
53.2
134University of UtahUnited States
53.2
134Indiana UniversityUnited States
53.2
137Tohoku UniversityJapan
53.1
137Hebrew University of JerusalemIsrael
53.1
139University of GlasgowUnited Kingdom
53.0
140KTH Royal Institute of TechnologySweden
52.9
140VU University AmsterdamNetherlands
52.9
142Universität BaselSwitzerland
52.8
142University of LeedsUnited Kingdom
52.8
144Albert-Ludwigs-Universität FreiburgGermany
52.3
145Queen Mary, University of LondonUnited Kingdom
52.1
145Lancaster UniversityUnited Kingdom
52.1
147Osaka UniversityJapan
52.0
148Arizona State UniversityUnited States
51.9
149Technical University of DenmarkDenmark
51.7
150Boston CollegeUnited States
51.6
151University of BernSwitzerland
51.5
151Karlsruhe Institute of TechnologyGermany
51.5
153University of ExeterUnited Kingdom
51.3
154RWTH Aachen UniversityGermany
51.1
154University of California, RiversideUnited States
51.1
156Yeshiva UniversityUnited States
50.9
156Texas A&M UniversityUnited States
50.9
158Tel Aviv UniversityIsrael
50.5
158University of BirminghamUnited Kingdom
50.5
158University of São PauloBrazil
50.5
161University of AucklandNew Zealand
50.3
162University of ViennaAustria
50.2
162Stony Brook UniversityUnited States
50.2
164Université Catholique de LouvainBelgium
50.0
165University of DelawareUnited States
49.7
166Université Paris Diderot - Paris 7France
49.6
167University of Texas at DallasUnited States
49.5
168George Washington UniversityUnited States
49.4
169University of IowaUnited States
49.3
170École Normale Supérieure de LyonFrance
49.2
171University of OttawaCanada
49.0
171Universität BonnGermany
49.0
171University of LiverpoolUnited Kingdom
49.0
174Georgetown UniversityUnited States
48.9
174Rensselaer Polytechnic InstituteUnited States
48.9
176University of AdelaideAustralia
48.8
176University of East AngliaUnited Kingdom
48.8
176University of AberdeenUnited Kingdom
48.8
176University of ReadingUnited Kingdom
48.8
180Newcastle UniversityUnited Kingdom
48.6
180Université Joseph Fourier, GrenobleFrance
48.6
182City University of Hong KongHong Kong
48.5
183Yonsei UniversityRepublic of Korea
48.2
184Colorado School of MinesUnited States
48.0
184University of Illinois at ChicagoUnited States
48.0
184William & MaryUnited States
48.0
187University of TwenteNetherlands
47.9
187University College DublinRepublic of Ireland
47.9
189Medical University of South CarolinaUnited States
47.7
190Wake Forest UniversityUnited States
47.3
190University of Western AustraliaAustralia
47.3
192University of AntwerpBelgium
47.1
193Technion Israel Institute of TechnologyIsrael
46.9
193Iowa State UniversityUnited States
46.9
193University of MiamiUnited States
46.9
196University of VictoriaCanada
46.7
196University of LeicesterUnited Kingdom
46.7
198University at BuffaloUnited States
46.6
199Johann Wolfgang Goethe-Universität Frankfurt am MainGermany
46.4
200Birkbeck, University of LondonUnited Kingdom


FOREX 4U